

About YouTube Analytics
If you want to grow a YouTube channel, your analytics found in YouTube Studio is an essential key to your success. The ability to understand what is working and what is not points you in the right direction to success.
It’s worth noting this article is for the desktop version. There is a helpful YouTube studio app for your smartphone, which is covered in a different article.
Your Analytics Starting Point
Click on the YouTube studio icon found under your profile photo in the upper right corner of your YouTube page. You are taken to your dashboard where you find some basic information about your channel. The first card shows how your last video is doing compared to your previous videos for the same about of time.
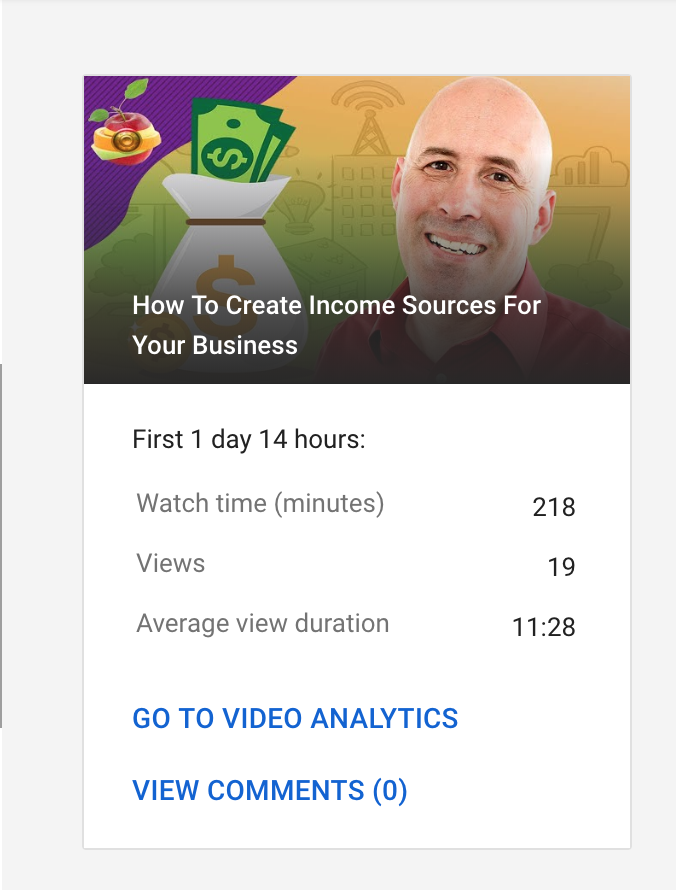
This is very helpful information. If your videos are in the top 5 of your last ten on a regular basis, this means you are moving in the right direction. Your videos are gaining viewers and more important, watch time.
To the right of this card is another card which offers basic analytics information for your channel as a whole. Such as subscribers, watch time and your channels top videos.
YouTube Channel Analytics Dashboard

YouTube Analytics Overview
The overview gives you a quick look at key metrics which you can view based on various date ranges located under a drop down in the upper right of the page.
You have five tabs at the top
When you click the analytics tab found on the left side of your screen on the desktop, you will see the graph displays the most important metric for YouTube. It’s called watch time. How much time viewers spent watching your videos over a specific period. The default time frame is 28 days.
- Overview
- Reach Viewers
- Interest Viewers
- Build An Audience
- Earn Revenue
Analytics Overview
- Overview (click on each for a graph)
- Watch Time
- Views
- Subscribers
- Revenue
- Top Videos Card (click for comparison of watch time, views, average view duration, impressions, impression click-through-rate, views
and average duration).- Metric Comparison List (MCL)
- Video
- Traffic Source
- Geography
- Viewer Age
- Viewer Gender
- Revenue Source
- Subscription Status (under more)
- Source
- Playlist
- Device type
- YouTube Product
- Live/On Demand
- Playback location
- Operating system
- Subtitles and CC
- Video Info Language
- Translation Use
- End Screen Element Type
- Card
- Sharing Service
- Metric Comparison List (MCL)
- Latest Activity Card
- Under title click for 48 hour or 60-minute view.
It’s best to take cues from YouTube. YouTube doesn’t show its creators what is most important to us, rather what is most important to YouTube. As you can see, watch-time is at the top of the list.
Next,
This is why YouTube gives you all of these metrics. The more information you have to create better videos our audience loves, the more revenue you can help make for the YouTube platform.
Reach Viewers
The information under this tab is extremely important. Again, take the order in which YouTube offers information has a hint as to its importance. In this group, we see Impressions, Impressions click-through rate, views
- Impressions
- Impression Click-Through Rate,
- Views
- Unique Views
Impressions are how many times your video thumbnails were shown to potential viewers. A potential view in this metric Includes only impressions on YouTube, not on external sites or apps. Below is a list of ways in which YouTube identifies impressions.
- Search results
- YouTube Home page
- YouTube feeds (subscriptions, trending, history, watch later)
- “Up Next” recommendations on the right side of the video player (includes autoplay)
- Videos in playlists
For example, if you embed your video on your blog the video impressions earned there are not in this calculation. Below is a list of sources which are not counted as impressions.
- External websites and apps
- YouTube mobile website
- Videos on YouTube TV, YouTube Kids, and YouTube Gaming apps
- Content within the video player (i.e., in cards, or end screens)
- Videos in email or push notifications
- Videos that play in the background tab (no visible impression)
- Videos whose thumbnails are less than 50% visible and/or visible for less than one second
- TrueView video discovery ads
As you can see, this impressions data which follow are only a subset or portion of the opportunities for your views to be viewed. With this knowledge, it’s important to use these metrics as a general guide, not the full analytics story.
Impressions click-through rate (CTR) measures how often viewers watched a video after seeing an impression on YouTube. Note: what are and are not impression opportunities are listed above.
According to YouTube half of all channels and videos on YouTube have an impressions CTR that can range between 2% and 10%.
Impressions Click-through rate is a highly important metric to try and improve. The fact is, you may have an excellent video, yet, if no one clicks on your video, there is no reason for YouTube to promote it.
It’s important to note that new videos less than 7 days old with less than 100 views can a wider range. For example, if you have a healthy subscriber count, many of the first views are your subscribers through Browse Features and notifications. These people are more likely to click on your video inflating the click-through rate.
Over time as YouTube promotes your videos, impression go up and you may see a decrease in CTR. However, I’ve seen the YouTube search and discovery system (algorithm) find a better audience for your video in which the CTR actually goes up over time.
It’s best to compare video CTRs over the long-term. It’s also important to understand that different traffic sources will affect the video CTR. You can view different traffic sources via the Metric Comparison List (MCL).
Views are how many times your video is watched. A view can be 5 seconds or the entire length of the video. Unique Viewers how many individual people viewed your video. An individual can account for multiple views. However, if that same person uses a different device, it can count as a different unique viewer.
Interest Viewers
The two graph metric under this tab
- Top Videos
- Top videos by end screen
- Top playlists
- Top end screen elements
- Top Cards
Each of these cards are clickable to compare using the Metric Comparison List (MCL) page. This information is helpful to help understand where your best watch time audience is coming from.
Build An Audience
This tab shares information about your community and its engagement. The three graph options are unique viewer (subscribers and subscribers), Average views per viewer and your total number of subscribers. Below are clickable cards related to the demographics of your YouTube viewers and community.
- Watch Time via subscribes and non-subscribers
- Gender
- Top Countries
- Age
- Top subtitle/CC Languages
This information is helpful to understand the demographics of the people who like your videos. It’s common for YouTuber to not understand who watches their videos. When you understand your audience, you can make better decisions about the type of videos you create and how to best promote your videos.
Each of
Earned Revenue
Once your channel gains a 1000 subscribers and earns 4000 hours of watch time during the course of a year, your channel qualifies for monetization. Here is more information about how to apply.
Under this tab, the graph shows your estimated revenue, estimated monetized playbacks and playback based on CPM.
Estimated monetized playback means how many times a viewer saw at least 1 ad while watching your video. This estimate includes cases where a viewer quits watching during the pre-roll ad.
Under the graphs you have clickable cards for comparison. This information is helpful to guide you toward making videos which earn the most revenue.
- Monthly Revenue (monthly comparisons)
- Revenue sources
- Top Earning Videos
- Ad Types
Individual Video Metrics
The above information is mostly about the metrics available in YouTube Studio as it relates to your channel as a whole.
This same information and more is available for your individual videos too. Click on videos found on the left sidebar, click on the video you want to see statistics, then click on analytics again. You will then see the familiar graphs and listed metrics overview, reach viewers, interest viewers, build an audience and earn revenue.
However, the graphs are a little different. The graphs show you how the individual video performs under each metric. A gray shaded region shows you the average range for your videos, which you can adjust the graph with the drop-down menu to compare your current video to your previous video.
Under each
Growing a YouTube channel is not easy. However, if you prepare yourself with good information and the understanding of what works and does not work in your videos, you increase your chance of success.
Much of this article is based on experience using YouTube Studio, however, there are excellent support resources which I take full advantage (and you should too) to help write this article.
Sources: YouTube studio help section, youtube-creators.googleblog.com